
📊 Performance
- Less than half of individual stocks generated positive lifetime buy-and-hold returns.
- Only 42.6% of stocks outperformed one-month US Treasury bills.
- The top 4% of stocks accounted for all net wealth creation in the US market since 1926.
- The median stock’s return was negative, emphasizing the impact of return skewness.
💡 Key Idea
Stock markets as a whole outperform safe investments, but most individual stocks fail to do so. Market gains are driven by a small fraction of stocks, creating a positively skewed return distribution.
📚 Economic Rationale
The findings challenge the assumption that most stocks provide a risk premium over risk-free assets. Instead, skewness in stock returns plays a major role. The small subset of extreme winners generates overall stock market gains, while the median stock lags behind.
🚀 Practical Applications
- Portfolio Diversification is Key – Concentrated stock portfolios have a high probability of underperformance.
- Passive Investing Works – Market-cap-weighted indices benefit from the outsized gains of a few winning stocks.
- Stock Selection is Difficult – Investors aiming to pick winners must identify the small fraction of stocks that drive market returns.
🛠️ How to Do It
Data
- CRSP monthly stock return data from 1926–2016.
- Market-cap-weighted vs. equal-weighted portfolios.
- Treasury bill returns for comparison.
Model/Methodology
- Buy-and-hold returns analyzed for all individual stocks.
- Wealth creation measured as market value accumulation above Treasury bill rates.
- Skewness and concentration effects explored using bootstrap simulations.
Strategy
- Avoid poorly diversified portfolios – Skewed stock returns mean missing out on top performers is costly.
- Favor systematic investing – Exposure to broad market indices captures the winners without excessive risk.
- Use historical data to inform risk assumptions – Investors should expect most stocks to underperform benchmarks.
📊 Table or Figure
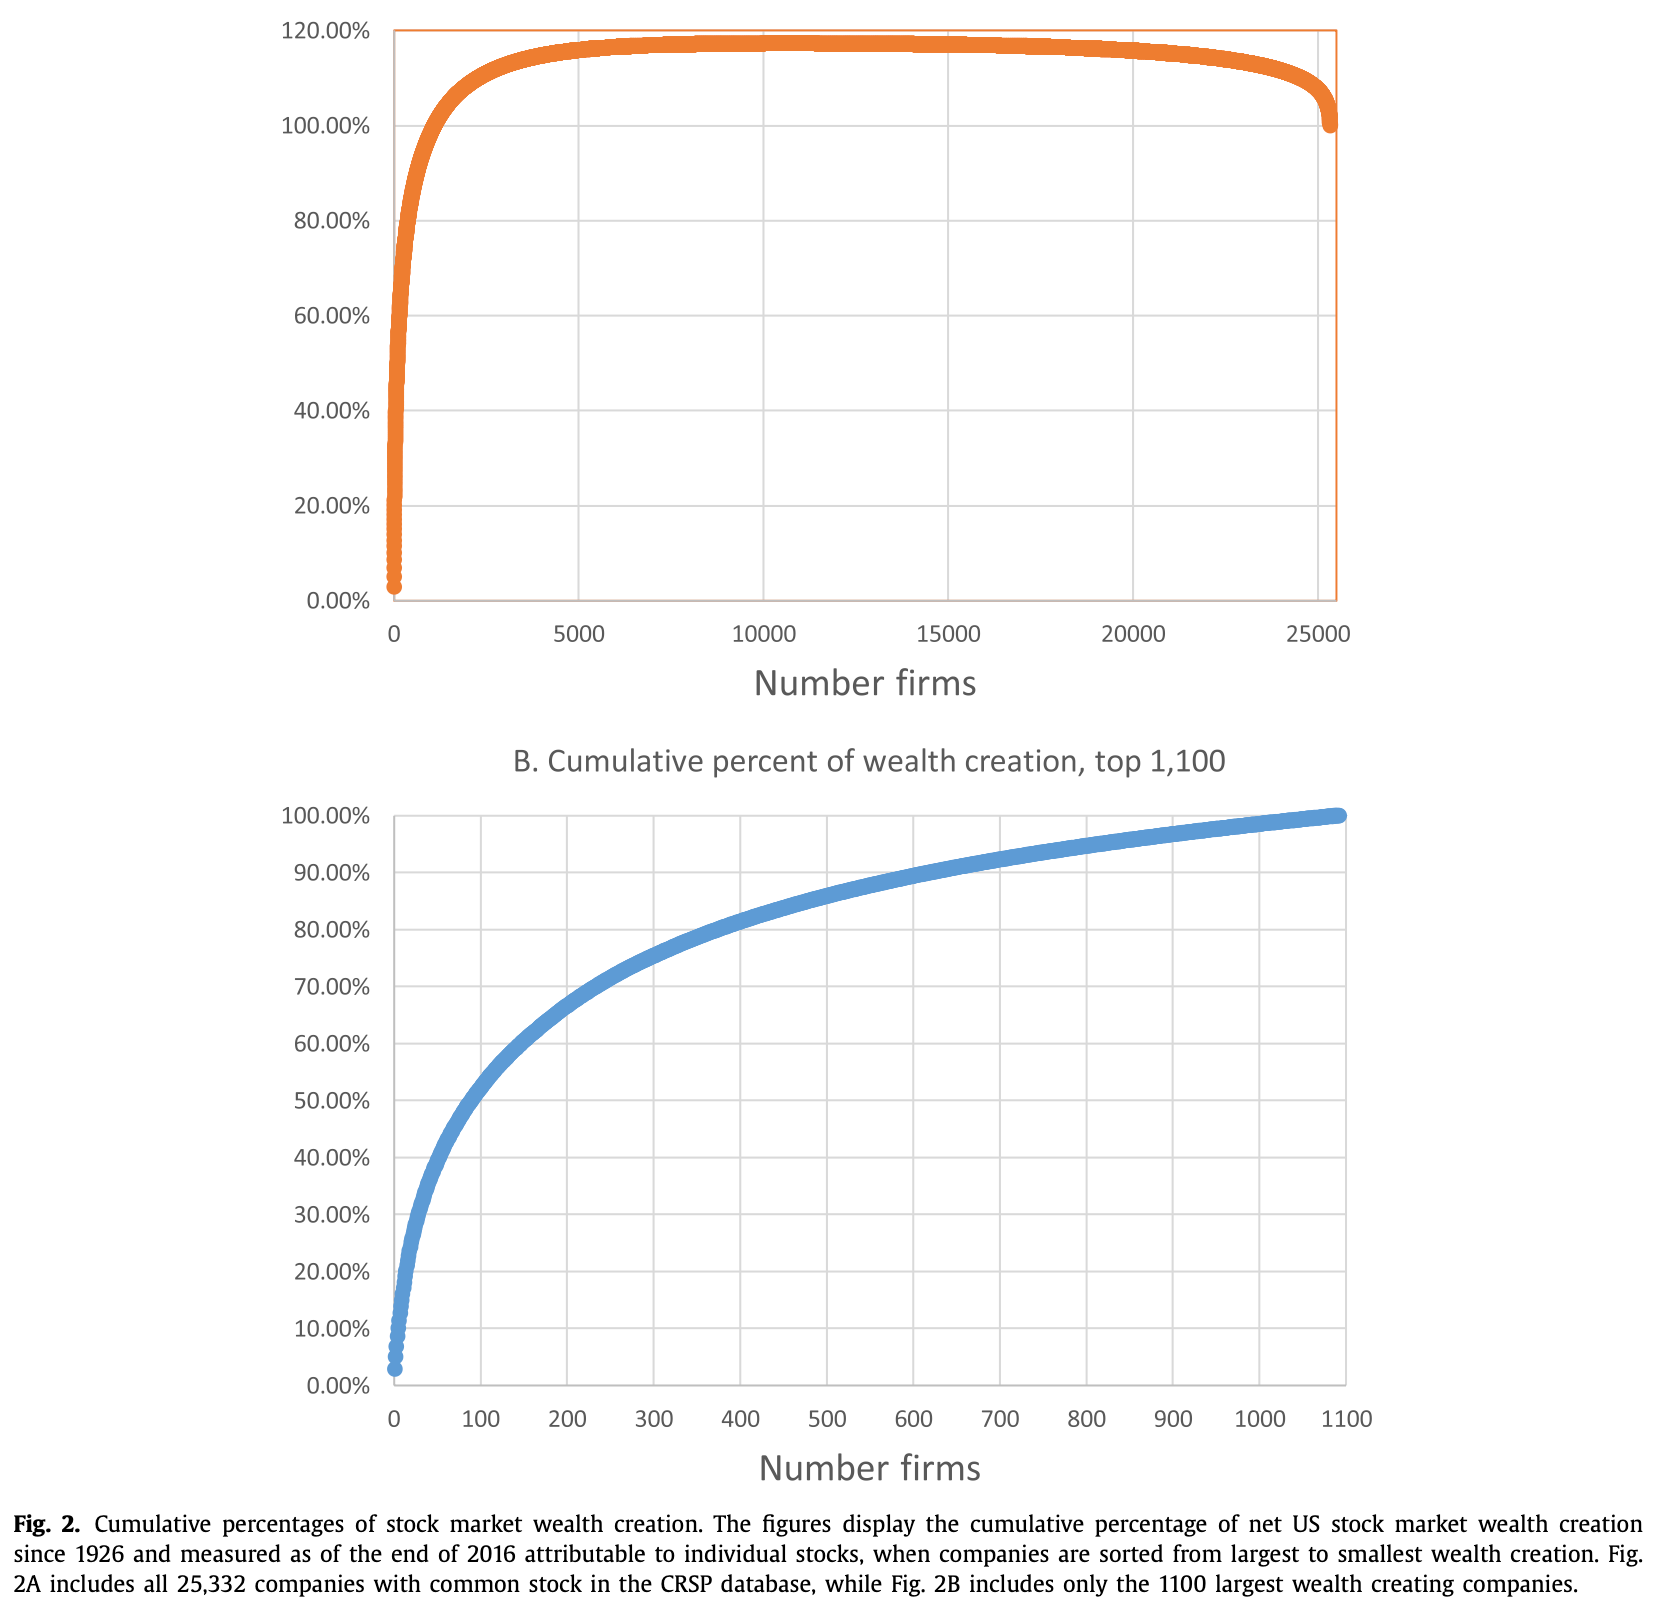
📌 The top 1,092 firms (4% of the market) account for all net stock market wealth creation since 1926, while the bottom 96% of firms collectively matched Treasury bill returns.
📄 Paper Details
- Author: Hendrik Bessembinder
- Journal: Journal of Financial Economics (2018)
- DOI: 10.1016/j.jfineco.2018.06.004